

As an accounting associate you may be asked to provide reports that may not be readily available as standard, or the report may be required in specific format. NAV allows you to design and create your reports and save them for future use. By following these steps you can create the basic structure of your report and by adding the Analysis View you can even use these reports to analyze departmental (dimensional) data. Lets begin creating basic reports by following these steps.
Creating basic reports
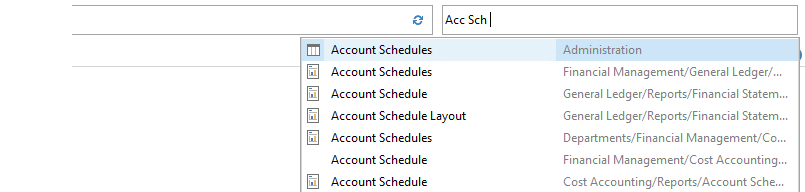
- In the search field type Account Schedule and choose the link. Or you can also use Departments->Financial Management->General Ledger->Analysis & Reporting.
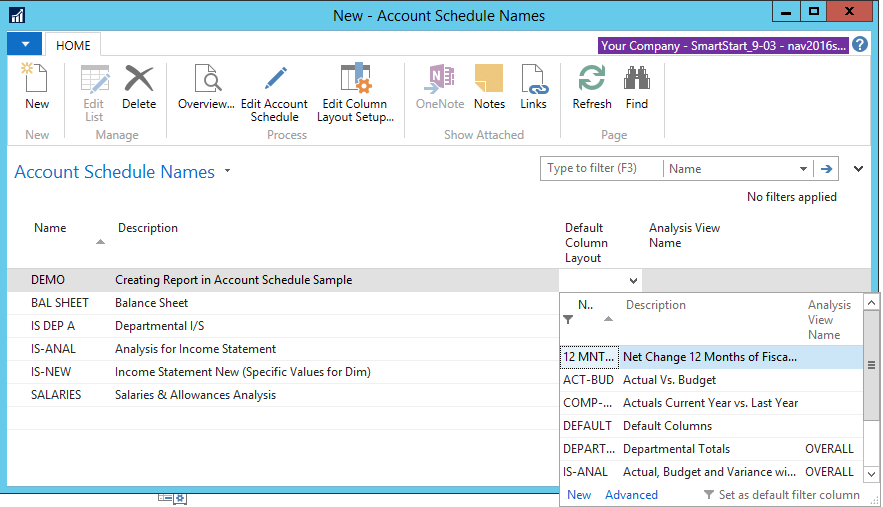
- Click New on ribbon to begin creating your report.
- Populate Name filed with a 10 digit code to identify your report.
- Populate the Description filed with detail explaining the contents of report for ease of identification.
- Populate the Default Column Layout by selecting the column that was previously created or you can create a new one (explained below).
Note: The Analysis View Name will be covered in separate article.
Create a new column layout
- To create a new column layout, select New on above screen's Default Column Layout popup.
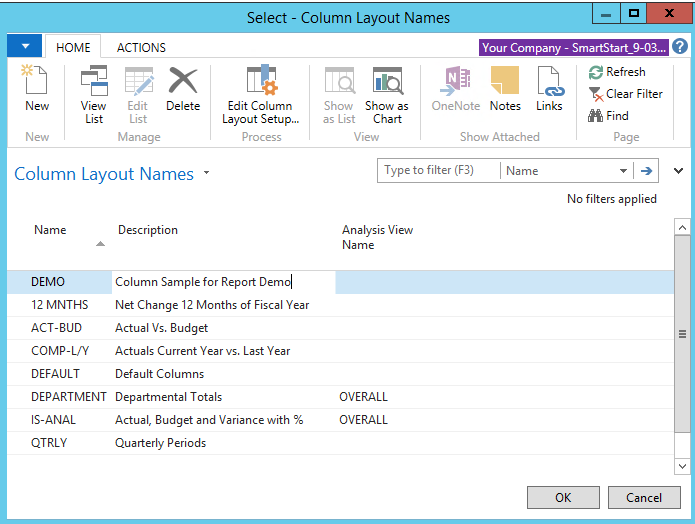
- A new screen for Column Layout Names will appear with a blank line for you to populate the Name and Description fields. Choose the values that you can identify with your report.
- Click Ok.
Create report rows
Now that you have the report and column names done, its time to create your report rows.
- With report name selected choose Edit Account Schedule on ribbon.
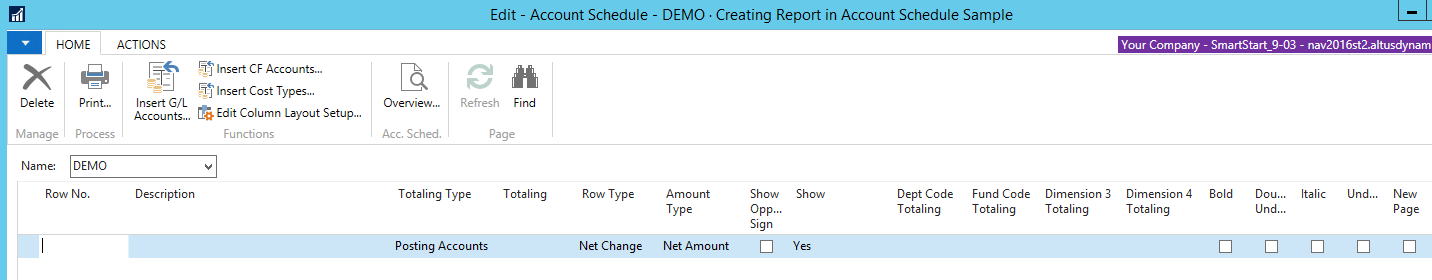
- In the edit option you will populate the fields based on your requirements, you can enter each field manually or can click Insert G/L Accounts on the ribbon.
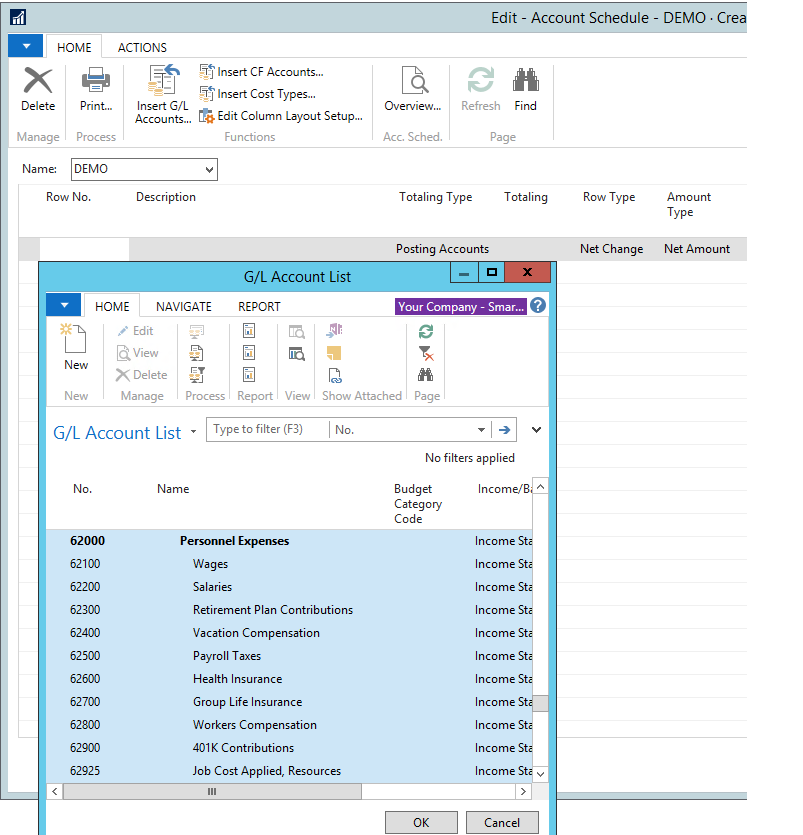
- If you select Insert G/L Accounts on ribbon, the system will display a screen showing a list of GL accounts.
- You can select the range or even cherry pick accounts to add as rows in your report.
Note: If needed, you can add or delete these rows as required later.
The table below is a brief discussion of some of the fields that requires your input:
| Field Name | Details |
| Row No. | The row number is completely optional, but highly recommended. This simple element of the row setup will eventually be one of the key features of your account schedule, allowing you to calculate and organize with ease. |
| Description | This is the one place you have to communicate, in words, what you’re showing on each line of your report. |
| Totaling Type (Posting Accounts / Formula) | This field tells NAV what you’re going to do here. You’re either going to pull data from your general ledger posting accounts or calculate a formula. |
| Totaling | Which general ledger accounts you want to pull or what formula you want to calculate. |
| Row Type (Net Change / Balance at Date) | The key here is knowing what type of accounts you’re reporting on. If you’re using income statement accounts (Revenue/Expense), then you need to use Net change. If you’re using balance sheet accounts (assets/liabilities), then you need to use Balance at Date. |
| Formatting Fields (Bold, Italic, Underline) | These basic formatting fields are there to allow you to emphasize some of the rows of your account schedules. When you select these options on any row, the whole row is effected. You are not able to effect a single cell” for formatting. What’s the difference between underline here and underline found in the Totaling Type options? You can get a more snug fit on your underline using this option since it appears in the same row of your data instead of in a row if its own. |
| New Page | A new page inserts a page break. This is commonly used when separating the pages of the balance sheet showing assets on the first page and liabilities and equity on the second page. I have also seen it used when folks build multi page account schedules. |
| Show Opposite Sign | This option allows you to select to change revenue credit balances or expense debit balances to the opposite sign for the purposes of presenting this data in a more non-finance friendly manner. No salesperson wants to see sales presented with a negative sign; use this to change that credit to a positive number on your reporting. |
| Show | Allows you to designate if a row will show (the default) or be hidden on the printed account schedule only. You can click this box as much as you want, but your rows will still show on-screen or when you export to Excel. If you print directly out of account schedules, this feature will work very well for you. |
| Dimension Totaling | This is the last option available and they are unique for just about every organization, and depending on your report setup, may even be different from schedule to schedule. You can use just one, or you can use all four of the available dimension totaling fields, in whatever combination you like. These fields act very much like the Totaling field because this is where you will tell NAV what Dimensions you want shown and totaled from your general ledger accounts. |
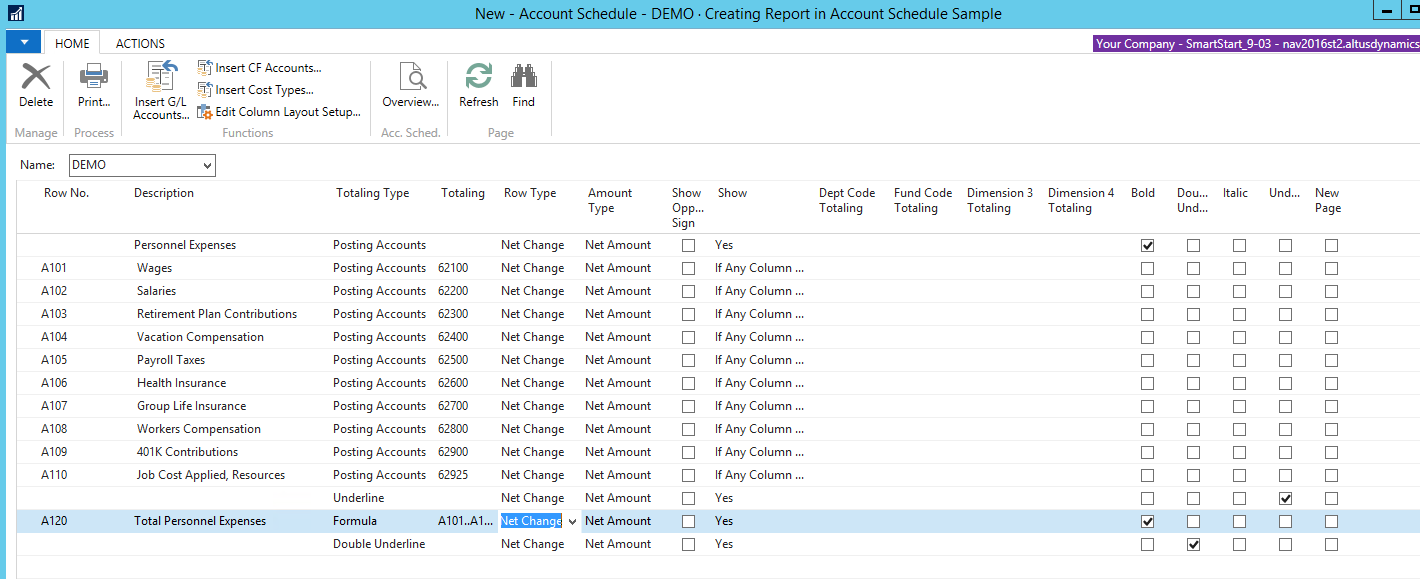
- After you have completed the rows setup, your report (account schedule) layout will look like this:
- Its time to take a first look at output, click Overview on the ribbon. The system will generate the first look of your report, you can change your Date filters on the General tab.
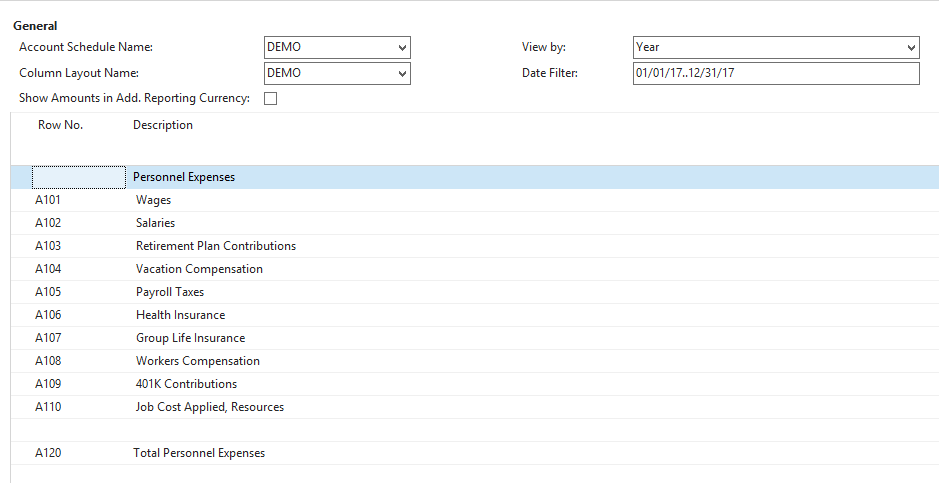
Note: The system did not bring any values in the report because we have to define columns to enable the system to know what data to pull and from where.
Define columns
- On screen click OK and again OK on next screen to get to Account Schedule Names screen, with your report name selected choose Edit Column Layout Setup on ribbon
- The column layout is where you will define periods of time to be used in your reports.
The table below describes the many options in the column layouts:
| Field Name | Details |
| Column No. | The column number is completely optional, but highly recommended. This simple element of the column layout will eventually be one of the key features of your account schedule, allowing you to calculate and organize with ease. |
| Column Header | This is where you’ll define, in words, what you’re showing in each column of your report. Keep it short; there is a 30 character limit. |
| Column Type (Net Change, Balance at Date, Formula) | Limit yourself to these three options when you’re getting started. The key here is knowing what type of accounts you’re reporting on. If you’re using income statement accounts (Revenue/Expense), then you need to use net change. If you’re using balance sheet accounts (Assets/Liabilities), then you need to use Balance at Date. Formula allows you to perform calculations in a column. |
| Ledger Entry Type | This column will allow you to define what type of ledger entries you will show. This is where you can choose actual general ledger entries or budgeted general ledger entries. |
| Formula | If you’ve chosen Formula as the Column Type, this is where you’ll put the formula. |
| Comparison Period Formula | This column allows you to define date formulas that are used to calculate the amounts shown. I generally recommend that beginning account schedule users start out using the comparison period formula field instead of the comparison date formula field. The comparison period formula field references the accounting periods set up in the fiscal year, so this option seems the most consistent, and is especially necessary for companies that may not follow a calendar fiscal year. Common data labels used in this field are CP for current period or -1P for previous period and FY for fiscal year or -1FY for prior year. |
| Show | Allows you to designate if a row will show (the default) or be hidden on the printed account schedule only. You can click this box as much as you want, but your rows will still show on-screen or when you export to Excel. If you print directly out of account schedules, this feature will work very well for you. |
| Show Opposite Sign | This is the option you can select to change revenue credit balances or expense debit balances to the opposite sign for the purposes of presenting this data in a more non-finance friendly manner. No salesperson wants to see sales presented with a negative sign; use this to change that credit to a positive number on your reporting. |
| Dimension Totaling | They are unique for just about every organization, and depending on your report setup, may even be different from schedule to schedule. You can use just one, or you can use all four of the available dimension totaling fields, in whatever combination you like. These fields act very much like the Totaling field because this is where you will tell NAV what Dimensions you want shown and totaled from your general ledger accounts. |
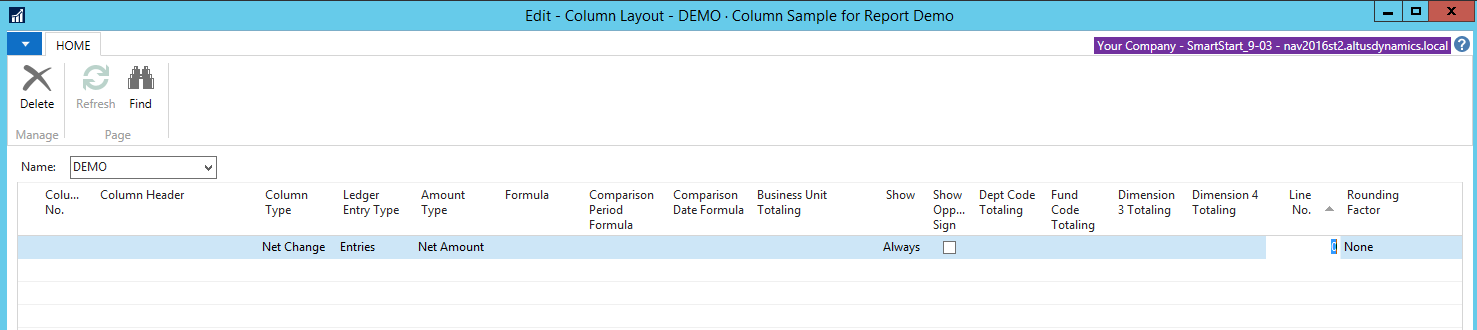
- Once you have defined column setup it will look something like this.
Note: You may have dimension values if your report is set for specific dimension, or it will be blank if it is set for the entire organization.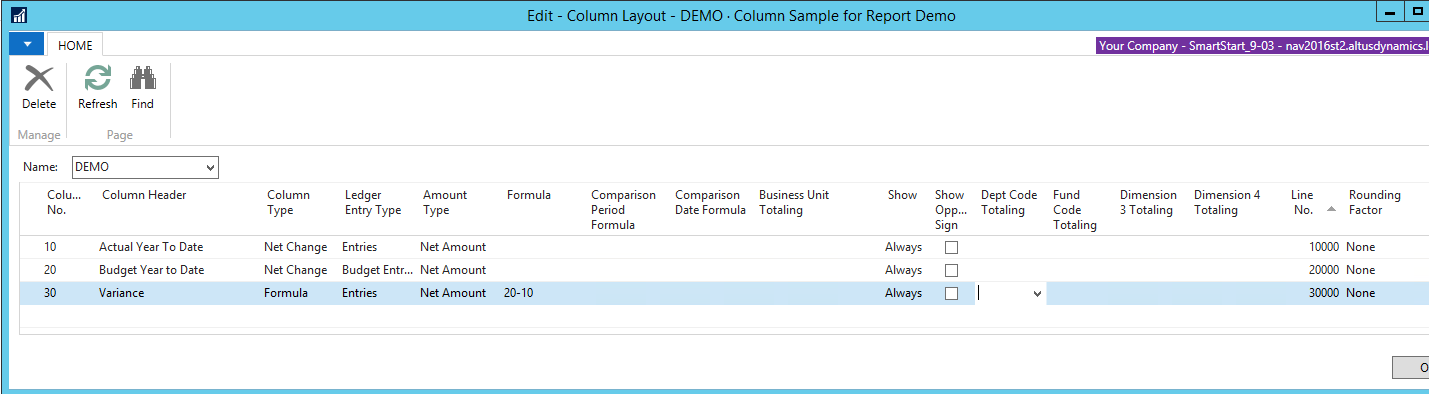
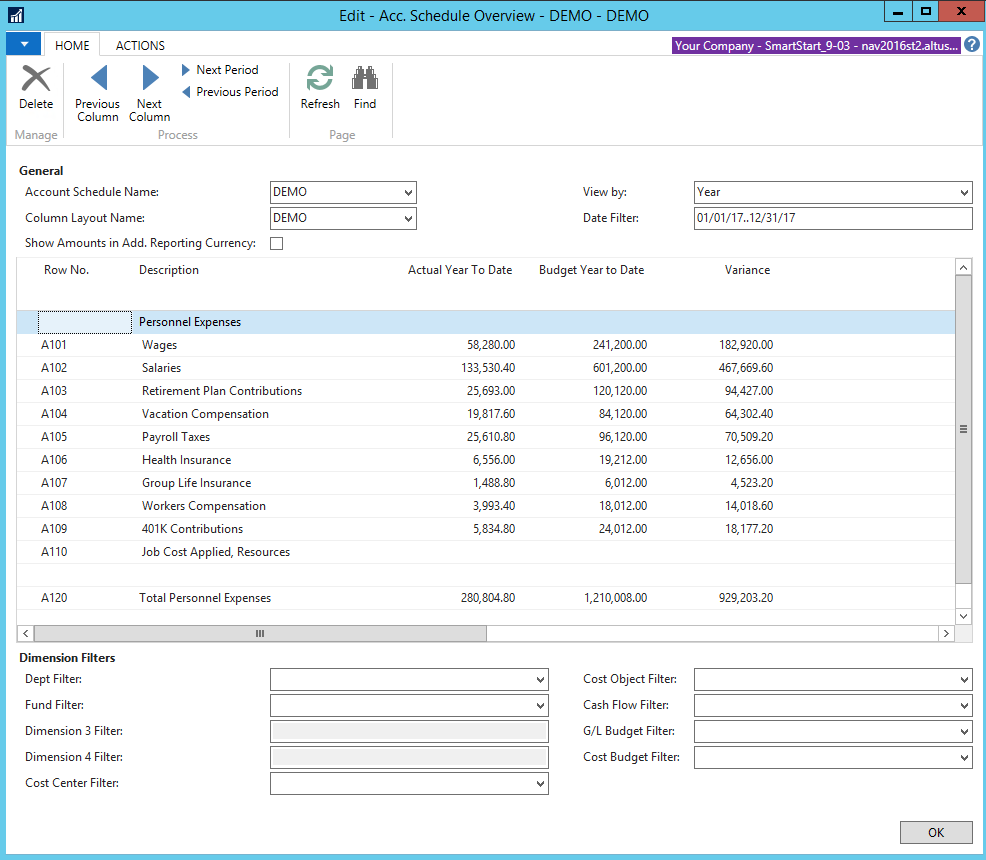
- Now try again to see an overview of your report, by clicking on Overview on ribbon. You should get a report that looks similar to this:
Preview, print, or create a PDF of the report
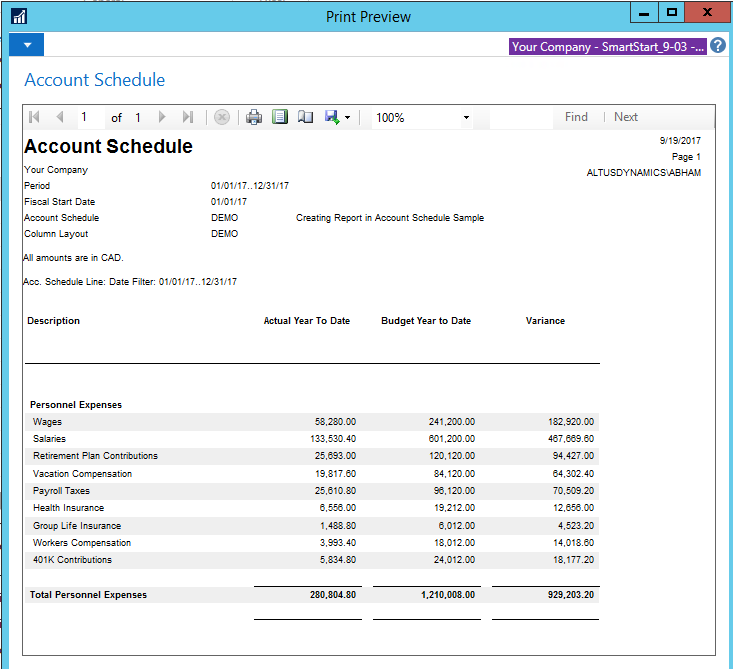
- You can generate preview, print hard copy or have the report created in PDF or Word format. On the Action tab select Print and the system will offer you the option to select your parameters. All current settings will be defaulted however changes can be made. From the Print button at bottom select your option and the result will also show the formatting.
- These steps will to enable the creation of basic reports. You can still filter your report by two Global dimensions using Dimension Filters in overview mode.
Note: To incorporate more dimensions you will need to attach Analysis Views to your report. This will be explained in a separate article.