

Businesses running ERP systems capture a tremendous amount of data through daily activity. This data, which reflects such things as the organization's sales figures, purchases, operational expenses, employee salaries, and budgets, can become valuable information for decision makers when they know how to use it.
The section is to demonstrate a number of ways that the information workers—those responsible for making strategic decisions—can easily generate business intelligence out of their organization's Microsoft Dynamics® NAV database. Reports that identify and capture strategic data are a fundamental component of business intelligence.
In addition to providing an overview of business intelligence, this training describes how to generate reports out of the Chart of Accounts, from determining the data to include in the reports, to designing the layout.
Analyzing the Chart of Accounts
Microsoft Dynamics NAV provides standard analysis accessible from the chart of accounts. This section explains applying filters to analyze G/L accounts and the five balance analysis pages available from the Chart of Accounts page.
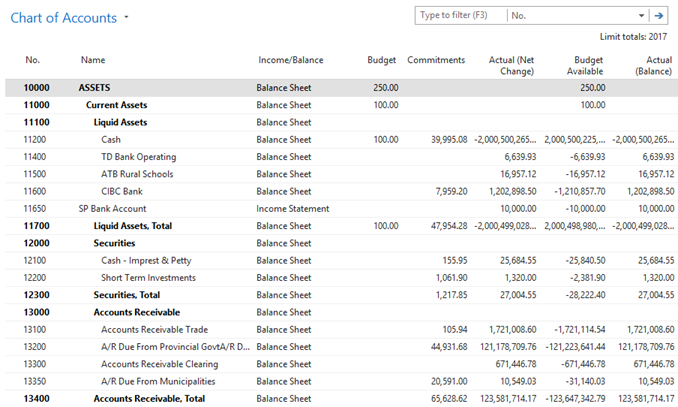
The amounts for each account are determined by summing the G/L entries for the account. The following table shows the calculated amount fields in the Chart of Accounts page.
| Field | Description |
| Net Change | The sum of the G/L entries for a date range determined by the Date Filter limit totals to filter. |
| Balance | The current balance of the account. This is the sum of all G/L entries for the account. The Date Filter is ignored. |
| Balance at Date | The balance of the account at the date entered in the Date Filter limit totals to filter. If a date range is entered in the Date Filer, only the ending date is used. |
When users apply a limit totals to filter, the ledger entries that are summed for the G/L accounts can be determined. The limit totals to filters available for the chart of accounts are shown in the following table.
| Limit Totals to Filter | Field |
| Budget Filter | Filters the amounts displayed for each account based on the Budget field of the G/L Budget Entries for the account. |
| Business Unit Filter | Filters the amounts displayed for each account based on the Business Unit Code field on the G/L Entries and G/L Budget Entries for the account. |
| Date Filter | Filters the amounts displayed for each account based on the Posting Date field on the G/L Entries and G/L Budget Entries for the account. |
| Global Dimension 1 and Global Dimension 2 Filters (also called Department Filter and Project Filter) | Filters the amounts displayed for each account based on the Global Dimension 1 Code field and Global Dimension 2 Code field on the G/L Entries and G/L Budget Entries for the account. In the demonstration company, these filters are the Department Filter and Project Filter. |
Balance Analysis in the Chart of Accounts
To simplify the process of applying limit totals to filters to the Chart of Accounts, some standard analysis pages are available, including:
- G/L Account Balance
- G/L Balance
- G/L Balance by Dimension
- G/L Account Balance/Budget
- G/L Balance/Budget
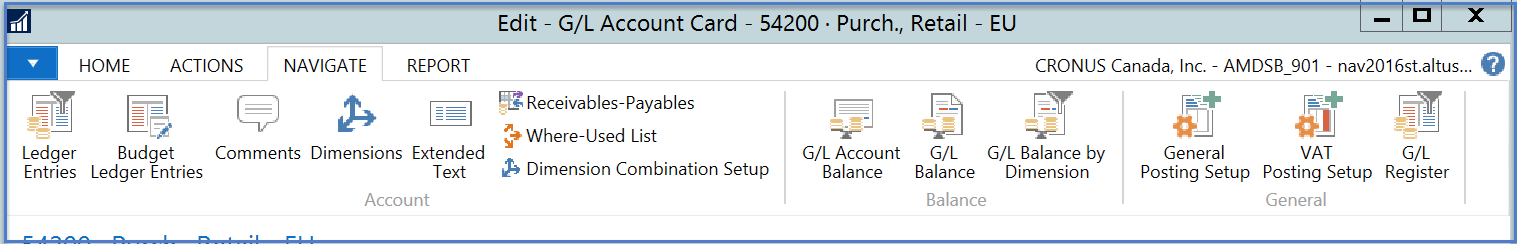
Access these analysis pages in the Chart of Accounts page by clicking the Related GL Account> Navigate.
Reviewing G/L Account Balances
The G/L Account Balance page contains the total G/L entries for a single account over several time periods. The account displayed is the one that the cursor was on in the Chart of Accounts when the page was opened.
For each period, users can view the Net Change, Debit Amount, and Credit Amount of the G/L entries posted to the account. Additionally, users can filter amounts by budget, business unit, date, and dimensions with the limit totals to filters.
To review the G/L Account Balance page, follow these steps:
- Navigate to Departments > Financial Management > General Ledger > Chart of Accounts > G/L Account Balance, or from the Chart of Accounts page, from the Ribbon click G/L Account Balance.
The G/L Account Balance page displays.
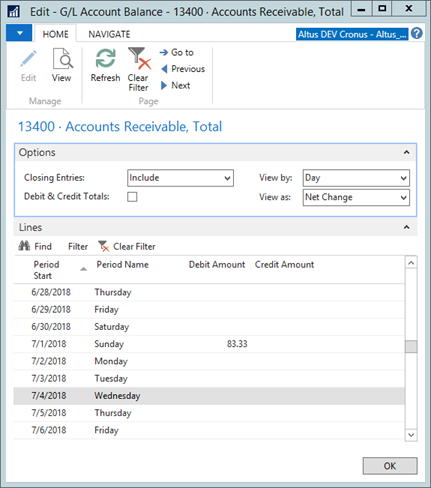
- On the Options FastTab select the filters to apply. For example, in the View by field, enter Month to view the entries by month.
- On the G/L Account Balance page, the Options FastTab contains the fields shown in the following table:~
| Field | Description |
| Closing Entries | Determines whether to include or exclude closing entries in the amounts. |
| Debit & Credit Totals | When this check box is selected, Microsoft Dynamics NAV separately displays the debit and credit amounts posted in the same period. If not selected, the net of all the entries posted in that period are displayed as Debit Amount or Credit Amount. |
| View by | Determines the time period displayed for each line. The options are Day, Week, Month, Quarter, Year, and Accounting Period. The date in the Start Date field on each line will always be the starting date for each period. |
| View as | Determines what type of amount will be shown in the columns: Net Change or Balance Date.
|
Together, time periods and amount types determine the following:
- If the View by field is greater than one day, and net change amounts are displayed, the date on a line represents the starting date of the time period.
- If the period is greater than one day, and balance amounts are displayed, the balance will be based on the ending date of the time period.
For example, if the View as option is set to Balance at Date and the View by option is set to Month, for the line with a Period Start of 01/01/13, the balance displayed will be the balance on January 31, 2016.
Using the limit totals to filters, amounts can also be filtered by:
- Budget
- Business Unit
- Date
- Global Dimension 1 and 2 Filters (called Department and Project Filters in the CRONUS demonstration company)
Reviewing G/L Balances
The G/L Balance page displays the total of G/L entries for all accounts for a specified time period.
To review the G/L Balance page, follow these steps:
- Navigate to Departments > Financial Management > General Ledger > Chart of Accounts > G/L Balance, or on the Chart of Accounts page, from the Ribbon click G/L Balances.
The G/L Balances page displays.
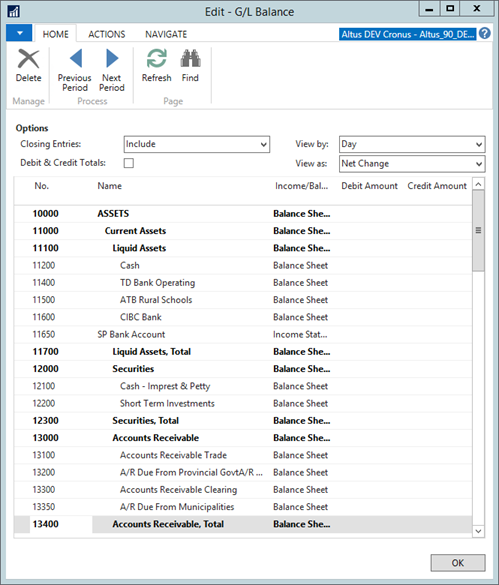
- In the View by field, enter Month to view the entries by month.
The G/L Balance page contains the same amounts and filters as the G/L Account Balance page.
Additionally, the Action Pane contains the Previous Period and Next Period menu items. These menu items provide the ability to quickly display the same amounts from prior and future periods.
In addition to the time period menu items, users can set more complex date filters in the Filter Pane using the limit totals to feature. With this feature, users can combine selected entries from different periods.
G/L Balances by Dimension
The G/L Balance by Dimension page provides dimensional analysis of actual or budgeted entries in a user-defined format. This page has the same format as the Analysis by Dimensions page, but is built on G/L Entries and G/L Budget Entries instead of Analysis View entries and Analysis View budget entries. As a result, only global dimension information can be viewed in this page.
To review the G/L Balance by Dimension page, follow these steps:
- Navigate to Departments > Financial Manage > G/L > Chart of Accounts > G/L Balance by Dimension, or on the Chart of Accounts page, from the Ribbon click G/L Balances by Dimension.
The G/L Balances by Dimension page displays.
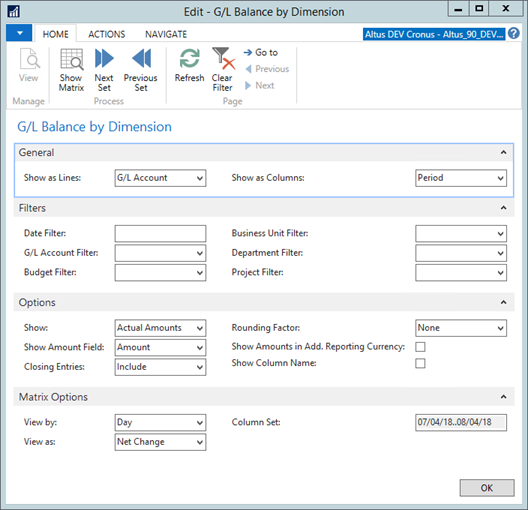
- Expand the Matrix Options FastTab.
- In the View by field, enter Month to view the entries by month.
- On the Ribbon, click Show Matrix.
Reviewing G/L Account Balances and Budgets
The G/L Account Balance/Budget page compares actual and budgeted entry totals for a single account over several time periods.
- In the Search field, type Chart of Accounts and select the page from the drop-down list, or navigate to to Departments > Financial Management > General Ledger > Chart of Accounts.
The Chart of Accounts page displays. - In the Filter Pane, in the Type to filter field, type the account number and then press ENTER to filter on the Sales, Retail - Dom. account.
- On the Ribbon, click Navigate > G/L Account Balance/Budget.
The G/L Account Balance/Budget page displays.
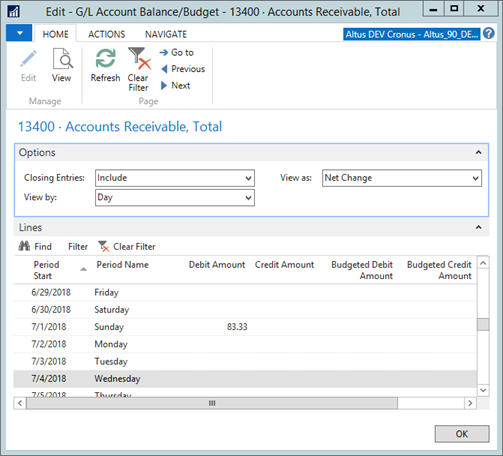
- In the View by field, enter Month to view the entries by month.
- The G/L Account Balance/Budget page contains the same amounts as the G/L Account Balance page.
However, in addition to actual amounts, the page also contains the budgeted debit amount, budgeted credit amount, and the net budgeted amount for the same periods. The comparison of the posted entries to the budget entries is calculated as an Index percentage in the Balance/Budget (%) field. - The filters are the same as the G/L Account Balance page except for two differences:
- There are no Debit & Credit Totals because budgeted debit and credit amounts are not recorded directly on the G/L Budget entries.
- There is an automatic Budget Filter limit totals to filter setting for filtering the budget information included in the page.
Reviewing G/L Balances and Budgets
The G/L Balance/Budget page compares actual and budgeted entries for all accounts for a specified time period.
To review the G/L Balance/Budget page, follow these steps:
- In the Search field, type Chart of Accounts and select the page from the drop-down list, or navigate to to Departments > Financial Management > General Ledger > Chart of Accounts.
The Chart of Accounts page displays. - From the Ribbon, click G/L Balance/Budget.
The G/L Balance/Budget page displays. - In the View by field, enter Month to view the entries by month.
The amounts and the filters included in the analysis are the same as the G/L Account Balance/Budget page. Additionally, the Date Filter limit totals to filter, Previous Period, and Next Period menu items are available.