

Talent Acquisition Dashboards
Applicant Tracking operational dashboards are a powerful reporting tool that offer your team leads and senior staff insight into key hiring processes while reflecting real-time activities. Your organization can leverage the collective information to track current performance key metrics and KPIs in order to refine areas to enhance the overall business.
Talent Acquisition dashboards are located on the main screen and provide a centralized view to track activities that have an impact on the quality and efficiency of the hiring process. You can easily view:
- Requisition Transition Times - Days between Approval and Posting - Top 10 Longest Open
- Requisition Transition Times - Days between Posting and Actual Closure - Top 10 Longest Open
- Requisition Transition Times - Days between Planned and Actual Closure - Top 10 Longest Open

Entity-Specific Dashboards
Applicant Tracking system charts are visualizations that reflect metrics that are specific to a certain entity. You can find system charts on a number of entities including the following:
- Requisitions
- Job Openings
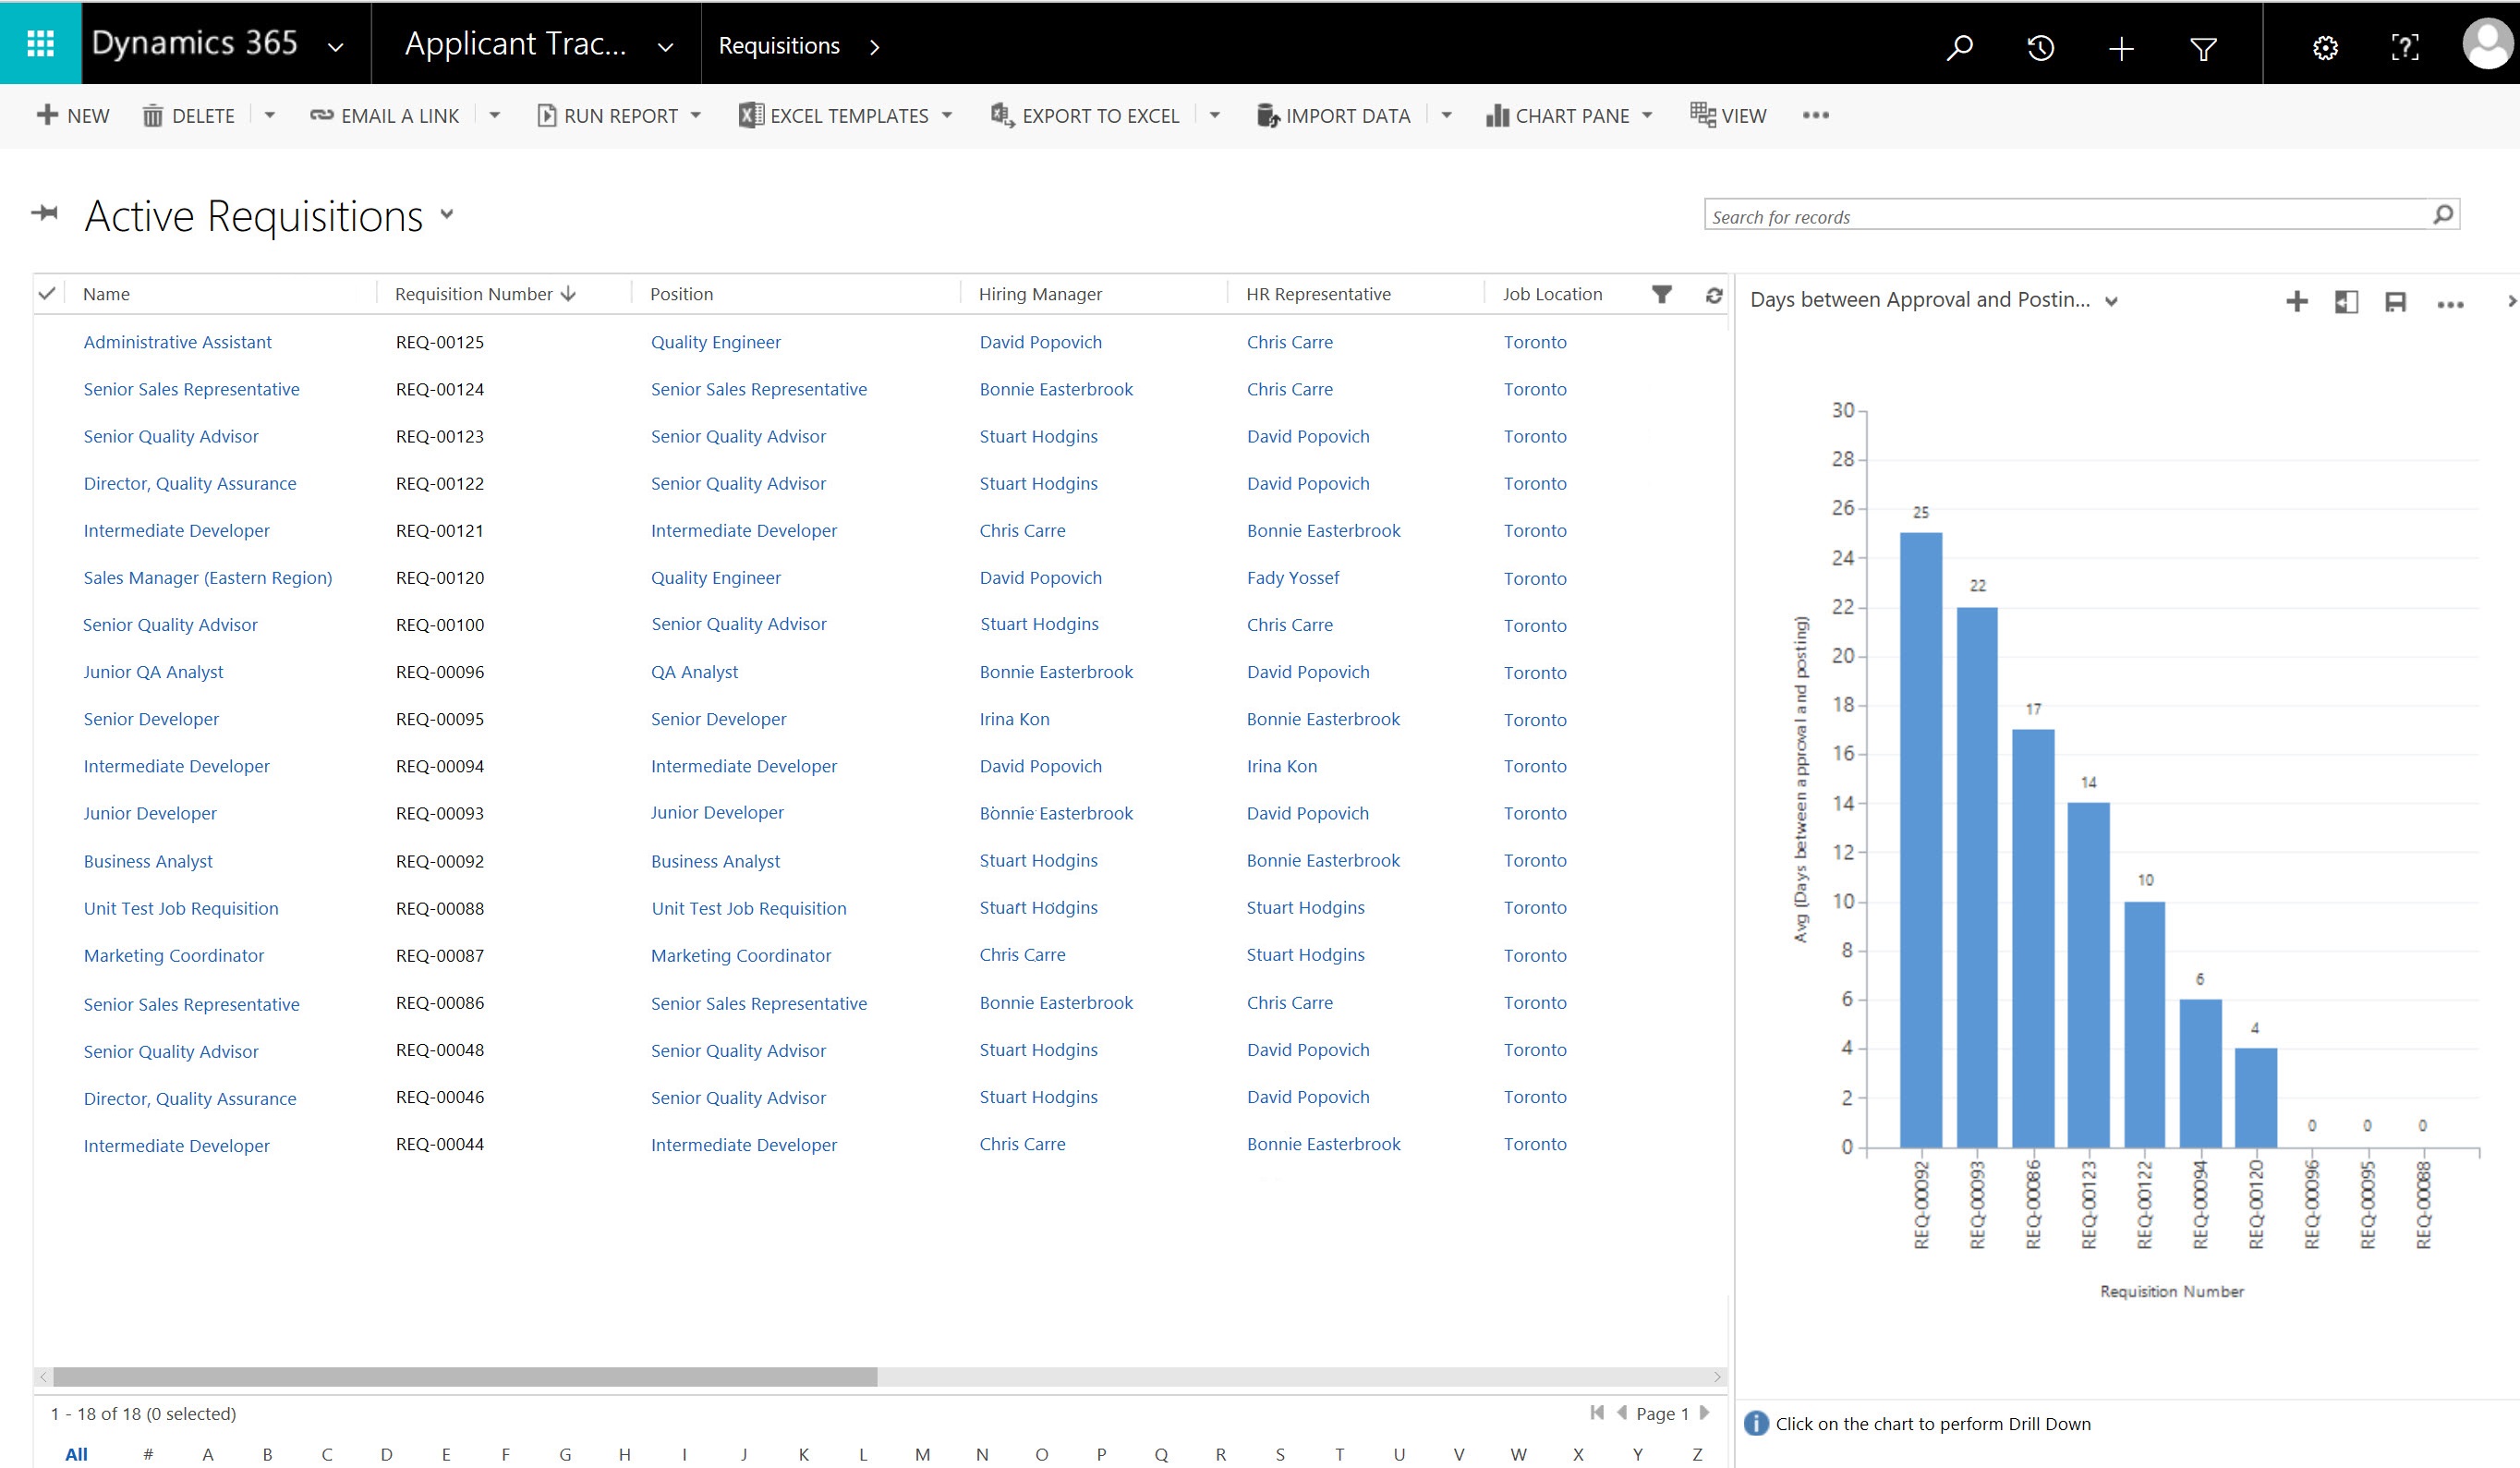
Requisitions
- Select the Applicant Tracking work area from the navigation bar.
- Click on the Requisitions item.
- The Requisitions view displays a list of all Active Requisitions by default.
- Click the Charts slider arrow on the far right of the screen.
NOTE: Click the arrow again to collapse or hide the chart. - The panel will expand to display the chart.
- Click on the drop arrow beside the chart title to select from one of the charts (see the listed options below).
Requisition System Charts
- Days between Approval and Posting - Top 10 Longest Open
- Days between Planned and Actual Closure - Top 10 Longest Open
- Days between Posting and Actual Closure - Top 10 Longest Open
Job Openings
- Select the Applicant Tracking work area from the navigation bar.
- Click on the Job Openings item.
- The Job Openings view displays a list of all Active Job Openings by default.
- Click the Charts slider arrow on the far right of the screen.
NOTE: Click the arrow again to collapse or hide the chart. - The panel will expand to display the chart.
- Click on the drop arrow beside the chart title to select from one of the charts (see the listed options below).
Job Openings System Charts
- Days between Approval and Posting Per Job Opening - Top 10 Longest
- Days between Opened and Hired - Top 10 Longest
NOTE: Additional system charts can only be created by users with the security role of System Admin. The charts are visible to all users by default.